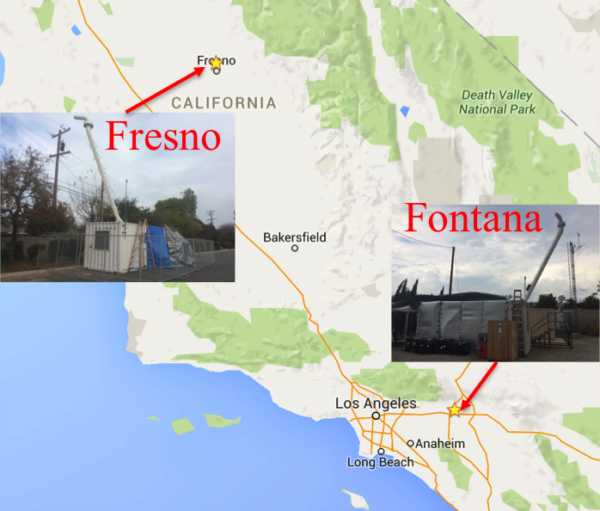
Aerosol Composition and Size Measurements at Fresno and Fontana
About this collection
- Extent
-
1 digital object.
- Cite This Work
-
Russell, Lynn M.; Betha, Raghu; Sanchez, Kevin J.; Liu, Jun; Price, Derek J.; Chen, Chia-Li; Lee, Alex (2017). Aerosol Composition and Size Measurements at Fresno and Fontana. UC San Diego Library Digital Collections. https://doi.org/10.6075/J0VX0DF9
- Date Collected
- 2014-12-19 to 2015-01-13 (Fresno); 2015-07-04 to 2015-07-28 (Fontana)
- Date Issued
- 2017
- Principal Investigator
- Research Team Head
- Research Team Members
- Contributors
- Methods
-
Comprehensive aerosol measurements were carried out during winter (19 December 2014 to 13 January 2015) in Fresno (San Joaquin Valley) and summer (4 to 28 July 2015) in Fontana (Southern California Air Basin). The sampling site in Fresno, managed by University of California Davis, was located behind the UC extension building at 550 Shaw Ave. (36.810 N, 119.780 W). Residential buildings to the north, commercial complexes to the south, and the Yosemite Freeway to the west of sampling location allowed repeated daily measurements of both the residential wood burning and traffic emissions in Fresno. The sampling site in Fontana, managed by South Coast Air Quality Management District, was located behind the fire station at 14360 Arrow Highway (34.100 N, 117.490 W). Surrounded by the I-15 freeway to the west, I-10 freeway to the east, and an auto speedway to the south, the sampling location was primarily influenced by vehicular emissions.
An isokinetic inlet with a motorized horizontal shroud mounted on the sampling van was used to sample the ambient air. Air pulled through the inlet was distributed through a sampling plenum to the particle instruments housed in the van. Size distributions of sub-micrometer particles (0.01 - 1 μm) were measured with a Scanning Electrical Mobility Spectrometer (SEMS, Model 138 2002, Brechtel Manufacturing Inc., Hayward CA). The Single Particle Soot Photometer (SP2, Model SP2-C, DMT, Boulder CO) was used to measure refractory Black Carbon (rBC, or soot) mass and number concentrations, as well as size distributions in the 0.07 to 0.4 μm range. rBC and non-refractory coating materials (including organic, sulfate, nitrate, ammonium and chloride) on rBC were also measured by Aerodyne Soot-particle Aerosol Mass Spectrometer (SP-AMS) in Fontana. All the instruments were calibrated before and after each study. Flow sensors of SEMS were calibrated using a Gillibrator (Sensidyne, LP) to ensure the reliability of number concentrations and size distributions. Nebulized and size-selected aqueous suspension of fullerene soot (Alfa Aeser, Tewksbury MA) was used to calibrate the broadband and narrowband incandescence detectors to accurately measure rBC mass. Non-refractory aerosol mass and chemical composition were measured by High Resolution Time of Flight Aerosol Mass spectrometer (Model: HR-ToF-AMS with ET, Aerodyne, Billerica MA). The AMS was operated under a 5 min mode-switching cycle (V-mode, 2-min; LS-mode (UMR), 2-min; W-mode, 1-min), synchronized with the switching of a thermal denuder between a bypass mode and a denuded mode. Single-particle chemical composition was measured for 1 min of every 5 min using a light-scattering (LS) module coupled with the time-of-flight aerosol mass spectrometer. The chemical characterization of the single-particle measurements was carried out using the Clustering Analysis Panel (CAP). In addition filter samples were collected on pre-scanned Teflon filters (Teflon, Pall Inc., 37mm diameter, 1.0 µm pore size) at Fresno and Fontana behind PM1 and PM2.5 sharp-cut cyclones (SCC2.229 PM1 and SCC2.229 PM2.5, BGI Inc.), and a PM0.18 Berner type impactor [Russell et al. 2009]. Samples were then frozen and transported to the laboratory for FTIR spectroscopy analysis by a Tensor 27 spectrometer (Bruker Optics). All samples were kept in a relative humidity (35-45%) and temperature (20°C) controlled room for at least 24 hours prior to the analysis. Organic functional groups (carbonyl, amine, alcohol, alkane and carboxylic acid groups) were measured directly on all sampled filters by FTIR. Duplicate Teflon filters placed in-line behind 20% of the sampled filters were used as a measure of sample contamination or artifacts and contained negligible organic mass. An automated algorithm including baselining, peak fitting, and integration was used to interpret the FTIR spectrum from each filter [Russell et al. 2009]. The FTIR spectra are background subtracted and normalized to air volume to calculate mass concentration of each functional group, as well as organic mass and organic carbon concentrations. - Funding
-
California Air Resources Board (Agreement No: 13-330)
- Geographic
- Topics
Formats
View formats within this collection
- Related Resource
- Betha, R., Russell, L. M., Chen, C.-L., Liu, J., Price, D. J., Sanchez, K. J., et al. (2018). Larger submicron particles for emissions with residential burning in wintertime San Joaquin Valley (Fresno) than for vehicle combustion in summertime South Coast Air Basin (Fontana). Journal of Geophysical Research: Atmospheres, 123, 10,526– 10,545. https://doi.org/10.1029/2017JD026730
- Chen, C.-L., Chen, S., Russell, L. M., Liu, J., Price, D. J., Betha, R., et al. (2018). Organic aerosol particle chemical properties associated with residential burning and fog in wintertime San Joaquin Valley (Fresno) and with vehicle and firework emissions in summertime South Coast Air Basin (Fontana). Journal of Geophysical Research: Atmospheres, 123, 10,707– 10,731. https://doi.org/10.1029/2018JD028374
- Lee, A. K. Y., Chen, C.-L., Liu, J., Price, D. J., Betha, R., Russell, L. M., Zhang, X., and Cappa, C. D. (2017): Formation of secondary organic aerosol coating on black carbon particles near vehicular emissions, Atmos. Chem. Phys., 17, 15055–15067. https://doi.org/10.5194/acp-17-15055-2017
Primary associated publication
 Library Digital Collections
