Data from: Measuring Seafloor Strain with an Optical Fiber Interferometer
About this collection
- Extent
-
1 digital object.
- Cite This Work
-
Zumberge, Mark A.; Hatfield, William; Wyatt, Frank K. (2018). Data from: Measuring Seafloor Strain with an Optical Fiber Interferometer. UC San Diego Library Digital Collections. Dataset. https://doi.org/10.6075/J0BR8QD7
- Description
-
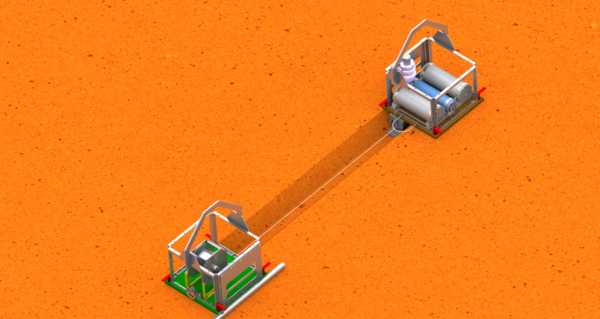
A 95.5 day long record of earth strain collected on the seafloor offshore Oregon was collected. The instrument used was a 200-m-long optical fiber cable, stretched between two anchors in an east-west line. The optical phase of 1310 nm laser light was recorded from the output of two interferometers, one for each of two optical fibers in the 200-m-long sensing cable. The fibers differ in their temperature coefficients by about 15% to facilitate separation of phase change due to strain from that due to temperature. Four data files are included: phase1, phase2, temperature, and time. Each is sampled at 20 samples per second.
Four data files are provided, each a vector of a single data type having 165 024 000 values.
The four variables are time, phase1, phase2, and temperature. The two phases are the optical phases from two optical fiber interferometers. The temperature data are from a thermistor on the reference mandrel.
The data files are readable with matlab using the statement "load <filename>"
The file sizes are:
499M phase1.mat
498M phase2.mat
129M temperature.mat
289M time.mat
Start: 2015 10 24 0 0 0 (2015:297:00:00:00)
End: 2016 1 27 11 59 59 (2016:027:11:59:59.95)
total duration: 95.5 days
Sample rate: 20 samples per second
Units:
phase1 and phase2: optical radians (floating point)
conversion factor: 0.45 nanostrain per radian (strain[nanostrain] = 0.45 * phase[radians])
temperature datalogger counts (-32,768 to 32,767)
conversion factor: T[deg C] = 0.0001739 * counts + 4.6716
time: seconds epoch time, seconds since 1970.0
location:
42 deg 28.164 minutes North
125 deg 15.869 minutes West
1910 m depth
azimuth: EastWest
length: 200 m
The seismometer data is available from the IRIS DMC, http://service.iris.edu/irisws/timeseries/docs/1/builder/ network name OO (as in Ocean Observatories), station HYSB1, channel LHE. - Date Collected
- 2015-10-24 to 2016-01-27
- Authors
- Funding
-
National Science Foundation, award numbers 1235384 and 1617828
- Topics
Formats
View formats within this collection
- Language
- English
- Related Resource
- Zumberge, M. A., Hatfield, W., & Wyatt, F. K. ( 2018). Measuring seafloor strain with an optical fiber interferometer. Earth and Space Science, 5, 371– 379. https://doi.org/10.1029/2018EA000418
Primary associated publication
 Library Digital Collections
