Data from: The Oceanic Barrier Layer in the Eastern Indian Ocean as a Predictor for Rainfall over Indonesia and Australia
Data from: The Oceanic Barrier Layer in the Eastern Indian Ocean as a Predictor for Rainfall over Indonesia and Australia
About this collection
- Extent
-
1 digital object.
- Cite This Work
-
Ivanova, Detelina P.; McClean, Julie L.; Sprintall, Janet; Chen, Ru (2021). Data from: The Oceanic Barrier Layer in the Eastern Indian Ocean as a Predictor for Rainfall over Indonesia and Australia. UC San Diego Library Digital Collections. https://doi.org/10.6075/J0MC8ZW3
- Description
-
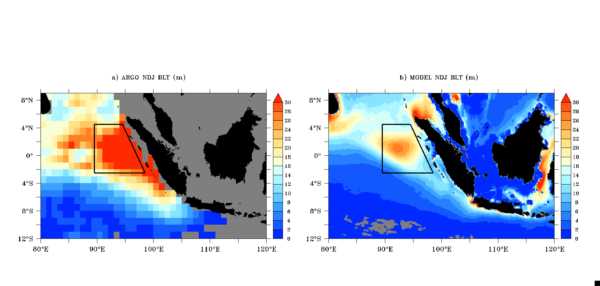
This is a collection of data and scripts in support of the manuscript “The Oceanic Barrier Layer in the Eastern Indian Ocean as a Predictor for Rainfall over Indonesia and Australia”. This study is focused on the relationship of the barrier layer in a region West of Sumatra (2.5°S - 4.5°N, and from 89.5E to 98.5°E at south boundary and 89.5°E-94.5°E at the north boundary) and the terrestrial rainfall over Indonesia and Australia. The collection consists of model and observational data including seasonal climatologies and monthly time series of ocean variables such as sea surface temperature and salinity, mixed layer depth, isothermal layer depth, barrier layer thickness, and atmospheric variables such as precipitation, heat fluxes (net, latent and sensible heat fluxes at the surface), outgoing longwave radiation at the top of the atmosphere, the wind stress, winds, the vertically integrated total moisture and moisture transport. The directory structure is organized in sub-folders for each of the manuscript figures. The data are in NetCDF-3 classic format. The scripts are in Matlab (version 2020b) and Ferret (version 6.4). In addition we have used the Climate Data Toolbox for Matlab.
The model data are from high-resolution fully coupled 1850 pre-industrial simulation carried out with the Energy Exascale Earth System Model version 0 (E3SMv0) (McClean et al, 2018). It includes the Community Atmosphere Model version 5 - Spectral Element (CAM5-SE), the Community Land Model version 4 (CLM4), the Los Alamos Parallel Ocean Program version 2 (POP2) and the Los Alamos sea ice model version 4 (CICE4). The nominal horizontal grid resolution is 0.25° in the atmospheric and land components and 0.1° in the ocean and sea ice components. The atmospheric model has 30 vertical hybrid levels. In the ocean model the vertical grid has 42 depth levels with variable thickness from 10 to 50 m in the upper 300 m. The ocean and sea-ice model components were initialized from a two-year spun up state of a global 0.1° POP2/CICE4 simulation forced with interannually-varying corrected Coordinated Ocean-ice Reference Experiments phase II product. The preindustrial simulation was integrated for 131 years, from which years 85-131 were used in the analysis.
The observational data sets include:
National Aeronautics and Space Administration (NASA) Tropical Rainfall Measuring Mission (TRMM0.25v7) for total precipitation (1986-2016): https://disc.gsfc.nasa.gov/datasets/TRMM_3B43_7/summary?keywords=TRMM_3B43_7.
The Scatterometer Climatology (1999-2007) of Ocean Winds (SCOW) available at: http://agate.coas.oregonstate.edu/scow/index.html
International Argo Program climatology (2004-2017) of temperature and salinity profiles Source: http://sio-argo.ucsd.edu/RG_Climatology.html - Creation Date
- 2018 to 2020
- Date Issued
- 2021
- Author
- Principal Investigators
- Contributor
- Funding
-
NASA award NNX13AO38G;U.S. DOE Office of Science/BER grant DE-SC0012778; NOAA NA17OAR4310257 and NSF 1851316; National Natural Science Foundation of China (42076007). Oak Ridge Leadership Computing Facility.
- Topics
Formats
View formats within this collection
- Language
- English
- Identifier
-
Identifier: Detelina P. Ivanova: https://orcid.org/0000-0003-1070-4100
Identifier: Janet Sprintall: https://orcid.org/0000-0002-7428-7580
Identifier: Julie L. McClean: https://orcid.org/0000-0002-8221-2714
- Related Resources
- Ivanova, Detelina P.; McClean, Julie L.; Sprintall, Janet; Chen, Ru. (2021). The Oceanic Barrier Layer in the Eastern Indian Ocean as a Predictor for Rainfall over Indonesia and Australia. Geophysical Research Letters. https://doi.org/10.1029/2021GL094519
- College of Oceanic and Atmospheric Sciences/Oregon State University. 2008. Scatterometer Climatology of Ocean Winds (SCOW), by Risien et al. Research Data Archive at the National Center for Atmospheric Research, Computational and Information Systems Laboratory. https://doi.org/10.5065/CJYS-R447
- International Argo Program climatology (2004-2017) of temperature and salinity profiles: https://sio-argo.ucsd.edu/RG_Climatology.html
- National Aeronautics and Space Administration (NASA) Tropical Rainfall Measuring Mission (TRMM0.25v7) for total precipitation (1986-2016): https://disc.gsfc.nasa.gov/datasets/TRMM_3B43_7/summary?keywords=TRMM_3B43_7
- International Argo Program climatology (2004-2017) of temperature and salinity profiles. https://sio-argo.ucsd.edu/RG_Climatology.html
Primary associated publication
Source data
Software
 Library Digital Collections
