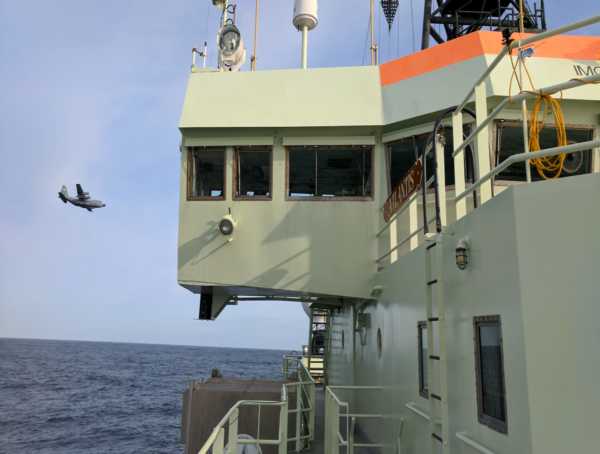
Aerosol Particle Chemical and Physical Measurements on the 2015, 2016, 2017, and 2018 North Atlantic Aerosols and Marine Ecosystems Study (NAAMES) Research Cruises
Aerosol Particle Chemical and Physical Measurements on the 2015, 2016, 2017, and 2018 North Atlantic Aerosols and Marine Ecosystems Study (NAAMES) Research Cruises
About this collection
- Extent
-
4 digital objects.
- Cite This Work
-
Russell, Lynn M.; Chen, Chia-Li; Betha, Raghu; Price, Derek J.; Lewis, Savannah (2018). Aerosol Particle Chemical and Physical Measurements on the 2015, 2016, 2017, and 2018 North Atlantic Aerosols and Marine Ecosystems Study (NAAMES) Research Cruises. UC San Diego Library Digital Collections. https://doi.org/10.6075/J04T6GJ6
- Date Collected
- 2015-11-06 to 2015-11-30; 2016-05-11 to 2016-06-05; 2017-08-30 to 2017-09-24; 2018-03-20 to 2018-04-13
- Date Issued
- 2018
- Principal Investigator
- Researchers
- Methods
-
Comprehensive aerosol measurements were collected as a part of interdisciplinary North Atlantic Aerosol and Marine Ecosystem Study (NAAMES). The four NAAMES research cruises measured aerosol particle properties on the R/V Atlantis in the North Atlantic Ocean in 2015 (6 November to 1 December), 2016 (11 May to 5 June), 2017 (30 August to 24 September), and 2018 (20 March to 13 April). The particle mass concentration, size distribution, and chemical composition of atmospheric aerosols were measured during both cruises. Ambient air containing marine aerosols up to several micrometers was sampled using a common inlet about 18 m above sea level. These aerosols were dried in diffusion driers before distribution to the instruments. Particles were also sampled from the Sea Sweep operated by NOAA Pacific Marine Environmental Laboratory (PMEL) [Bates et al. 2012 ]. Ambient and sea sweep particles were collected with a temperature controlled vertical inlet at ~15 m above sea level [Betha et al. 2017].
Size distributions of sub-micrometer particles (0.01 - 1 μm) were measured with a Scanning Electrical Mobility Spectrometer (SEMS, Model 138 2002, Brechtel Manufacturing Inc., Hayward CA). Dry ambient aerosol particle size distributions were measured with an Aerodynamic Particle Sizer (APS 0.5–20 μm Dp; TSI, Shoreview, Minnesota, model 3321) and an Optical Particle Sizer (OPS 0.3–10 μm Dp; TSI). A TSI model 3010 Condensation Particle Counter (CPC) measured total submicron particle concentration. A Single Particle Soot Photometer (SP2, Model SP2-C, DMT, Boulder CO) was used to measure refractory Black Carbon (rBC, or soot) mass and number concentrations, as well as size distributions in the 0.07 to 0.4 μm range. SEMS flow sensors were calibrated using a Gillibrator (Sensidyne, LP) before each study. Nebulized and size-selected aqueous suspension of fullerene soot (Alfa Aeser, Tewksbury MA) was used to calibrate the SP2 broadband and narrowband incandescence detectors to accurately measure rBC mass. Non-refractory aerosol mass and chemical composition were measured by High Resolution Time of Flight Aerosol Mass spectrometer (Model: HR-ToF-AMS with ET, Aerodyne, Billerica MA). Characteristics of single-particles were also investigated by the Event Trigger Single Particle (ETSP) mode of the HR-ToF-AMS. The chemical characterization of the single-particle measurements was carried out using the Clustering Analysis Panel (CAP).
Particles were collected on pre-scanned Teflon filters (Teflon, Pall Inc., 37mm diameter) behind a PM1 sharp-cut cyclone (SCC2.229 PM1, BGI Inc.) and PM0.18 and PM0.5 Berner type impactors. Samples were frozen and transported to the laboratory for FTIR spectroscopy analysis by a Tensor 27 spectrometer (Bruker Optics). All samples were kept in a relative humidity (35-45%) and temperature (20°C) controlled room for at least 24 hours prior to the analysis. Organic functional groups (carbonyl, amine, alcohol, alkane and carboxylic acid groups) were measured directly on sampled filters by FTIR [Russell et al., 2009]. Duplicate Teflon filters placed in-line behind 20% of the sampled filters were used as a measure of sample contamination or artifacts and contained negligible organic mass. The generated marine samples were dehydrated using the method outlined by Frossard and Russell [2012] to remove interference of sea salt hydrate bound water with the organic signal in the FTIR spectra. The FTIR spectrum from each filter was baselined and integrated at specific peak locations to determine the peak areas of the organic functional groups using an automated algorithm outlined by Maria et al. [2002] and revised by Russell et al. [2009] and Takahama et al. [2013]. The detected functional group are summed to calculate organic mass and organic carbon concentrations. - Funding
-
NASA Earth Venture Suborbital Program NNX15AE66G
- Geographic
- Topics
Formats
View formats within this collection
- Related Resources
- Saliba, G., Chen, C.-L., Lewis, S., Russell, L. M., Quinn, P. K., Bates, T. S., Bell, T. G., Lawler, M. J., Saltzman, E. S., Sanchez, K. J., Moore, R., Shook, M., Rivellini, L.-H., Lee, A., Baetge, N., Carlson, C. A., & Behrenfeld, M. J. (2020). Seasonal Differences and Variability of Concentrations, Chemical Composition, and Cloud Condensation Nuclei of Marine Aerosol Over the North Atlantic. Journal of Geophysical Research: Atmospheres, 125(19), e2020JD033145. https://doi.org/10.1029/2020JD033145
- Sanchez KJ, Chen CL, Russell LM, Betha R, Liu J, Price DJ, Massoli P, Ziemba LD, Crosbie EC, Moore RH, Müller M, Schiller SA, Wisthaler A, Lee AKY, Quinn PK, Bates TS, Porter J, Bell TG, Saltzman ES, Vaillancourt RD, Behrenfeld MJ (2018). Substantial Seasonal Contribution of Observed Biogenic Sulfate Particles to Cloud Condensation Nuclei. Nature Scientific Reports. https://doi.org/10.1038/s41598-018-21590-9
- NOAA Pacific Marine Environmental Laboratory: NAAMES1: https://saga.pmel.noaa.gov/data/download.php?cruise=NAAMES1
- NOAA Pacific Marine Environmental Laboratory: NAAMES2: https://saga.pmel.noaa.gov/data/download.php?cruise=NAAMES2
- NOAA Pacific Marine Environmental Laboratory: NAAMES3: https://saga.pmel.noaa.gov/data/download.php?cruise=NAAMES3
- NOAA Pacific Marine Environmental Laboratory: NAAMES4: https://saga.pmel.noaa.gov/data/download.php?cruise=NAAMES4
- Data also at NASA Langley Research Center: https://www-air.larc.nasa.gov/missions/naames/index.html
Primary associated publication
Related data
Previous version
 Library Digital Collections
