Browse by Collection
View current collections below. Click an image or link for a full description.
Page 6 of 23
Search Results
-
 Collection
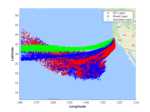
Data from: Contrasting Local and Long-Range-Transported Warm Ice-Nucleating Particles During an Atmospheric River in Coastal California, USA
- Data, modeling results and analyses supporting research into meteorology and ice nucleating particles.
- Date: 2016-03-05 to 2018-05-01
-
 Collection
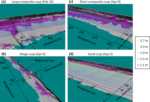
Data from: Cusp and mega cusp observations on a mixed sediment beach
- The dataset contains elevation rasters and gravel/cobble locations (North American Datum of 1983 (NAD 83), North American Vertical Datum of 1988 (NAVD 88)).
- Date: 2018 to 2019
-
 Collection
Data from: Cyclic(Alkyl)(Amino)Carbene Ligands Enable Cu-Catalyzed Markovnikov Protoboration and Protosilylation of Terminal Alkynes: A Versatile Portal to Functionalized Alkenes
- Included are the Gaussian output files (.chk, .fchk, and .log) from DFT calculations on the free carbenes explored in the protoboration and protosilylation of alkynes.
- Date: 2020 to 2021
-
 Collection
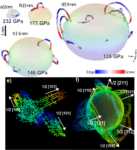
Data from: Diamond Response to Extreme Deformation
- Simulation input scripts and log output files, as well as selected data for the simulation of shock waves through single crystalline diamond with a void present.
- Date: 2023-06-06 to 2024-05-20
-
 Collection
Data from: Diminished efficacy of regional marine cloud brightening in a warmer world
- Marine cloud brightening simulation output generated using the Community Earth System Model (CESM) version 2.2 described in Wan et al. (accepted).
- Date: 2022-04 to 2023-12
-
 Collection
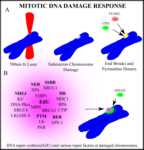
Data from: DNA damage induced during mitosis undergoes DNA repair synthesis
- A study of the DNA repair response to laser-induced DNA damage in selected mitotic chromosomes.
- Date: 2010 to 2019
-
 Collection
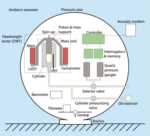
Data from: Drift-Corrected Seafloor Vertical Deformation at Axial Seamount 2013-2014
- Data from a Self-Calibrating Pressure Recorder (SCPR) deployed at Axial Seamount from 2013 to 2015. This is seafloor height change (cm), converted from pressure (kPa), corrected for ocean tides and pressure gauge drift.
- Date: 2015-08-25
-
 Collection
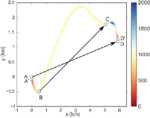
Data from: Eddy-induced acceleration of Lagrangian floats
- Simulated Argo float positions computed using velocities from the Estimating the Circulation and Climate of the Ocean, Phase II (ECCO2) project.
- Date: 2016 to 2019
-
 Collection
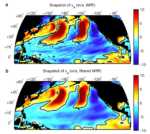
Data from: Effect of atmospheric forcing resolution on simulated mixed layer depth in the North Pacific
- This dataset contains daily output from two eddying ocean simulations in the North Pacific. The two experiments have the same configuration except for the atmospheric forcing resolution.
- Date: 2014 to 2018
-
 Collection
Data from: Electrostatic interactions as mediators in the allosteric activation of PKA RIalpha
- Molecular dynamics input files, trajectories and analysis scripts used in the paper "Electrostatic interactions as mediators in the allosteric network of PKA RIalpha".
- Date: 2015-09-15
-
 Collection
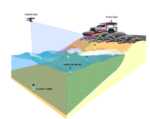
Data from: Enhanced surf zone and wave runup observations with hovering drone-mounted LiDAR
- Drone LiDAR data obtained during the SCaRP field experiment of Winter 2019-2020 at Torrey Pines State Beach in San Diego, California, USA.
- Date: 2019-12-14 to 2020-02-24
-
 Collection
Data from: Episodic Southern Ocean heat loss and its mixed layer impacts revealed by the furthest south multi-year surface flux mooring
- This dataset contains Quality Controlled daily mean air-sea heat flux estimates from the NSF Ocean Observatories Initiative Southern Ocean mooring site for the period 2015 to 2017, as used in the analysis of Ogle et al. 2018 (doi:10.1029/2017GL076909)
- Date: 2015 to 2017
-
 Collection
Data from: Evaluating the trustworthiness of explainable artificial intelligence (XAI) methods applied to regression predictions of Arctic sea-ice motion
- This dataset provides processed satellite and reanalysis data on sea-ice motion in the Arctic, along with statistical model predictions. It also includes code for processing the data, aimed at facilitating explainable AI analysis of model predictions.
- Date: 1989 to 2021
-
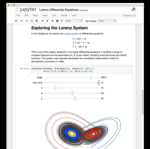 Collection
Data from: Exploration and Explanation in Computational Notebooks
- Analysis of approximately 1.25 million Jupyter Notebooks downloaded from public repositories on GitHub in July 2017.
- Date: July 2017
-
 Collection
Data from: Feasibility of continuous fever monitoring using wearable devices
- Sixty-five continuous days of data at one-minute resolution covering fifty individuals reporting COVID-19 infections starting on day 45 in the data set.
- Date: 2020-03 to 2020-06
-
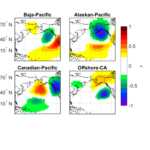 Collection
Data from: Four Atmospheric Circulation Regimes Over the North Pacific and Their Relationship to California Precipitation on Daily to Seasonal Timescales
- This dataset contains four indices of daily atmospheric variability associated with four circulation regimes over the North Pacific, which have been identified as essential drivers of atmospheric river landfall variability and California precipitation.
- Date: 2018
-
 Collection
Data from: Genuine Carbene Versus Carbene-Like Reactivity
- Optimized geometries, frequencies, and single point calculations for reactants, products, reaction intermediates, and transition states involved in forming cyclic(aryl)(amino)carbene-metal complexes and decomposition products.
- Date: 2023-04 to 2023-11
-
 Collection
Data from: Harmonic Analysis of Non-Phase-Locked Tides with Red Noise Using the red_tide Package
- Data, functions, and scripts associated with "Harmonic Analysis of Non-Phase-Locked Tides with Red Noise Using the red_tide Package" (Kachelein et al. 2022).
- Date: 2010 to 2021
-
 Collection
Data from: Harnessing AI data-driven global weather models for climate attribution: An analysis of the 2017 Oroville Dam extreme atmospheric river
- This study explores storyline-based climate attribution with AI global weather models, whose short simulation inference times allow one to generate real-time attributions when public attention is heightened. It focuses on the atmospheric river episode of February 2017 that contributed to the Oroville Dam spillway incident in Northern California. Attributions are compared to those from a dynamical model, which represent a plausible "pseudo-reality". This collection contains the data used and generated in the aforementioned study.
- Date: 2017-02-05 to 2017-02-11
-
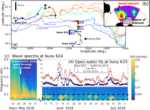 Collection
Data from: Ice break-up controls dissipation of wind-waves across Southern Ocean sea ice
- In situ wave observations and WaveWatch III model output for Ardhuin et al. (2020).
- Date: 2018-05 to 2018-07
 Library Digital Collections